 In the new survey, we collected data for 229 festival editions [of 133 different festivals] from 2015 to mid-year 2017. The focus was on festivals in 2016 with 116 festival editions and on 2017 with 48 festival editions [s. Table 1]. In total, the present and all previous surveys comprised, we collected data for 322 festival editions [182 festivals] from 2012 to June 30, 2017.
Table 1. Number of festivals by year

Festivals from 34 countries were included with 233 festival editions [72.4%] from Europe and 67 [20.8%] from North America. 98 festivals were included only once in the data collection, while for 46 festivals data was collected for two time points. 23, 12 and 3 festivals provided data for 3, 4, or 5 time points, respectively.
The mean [i.e. average] festival size was 58.9 acts with a minimum of 4 and a maximum of 726 act per festival. In total, 18956 acts are included in the present survey.
Gender Proportions of Festival Acts
Overall, for festivals in 2012 to mid-year 2017, 14% of all acts were female acts, 79% were male, 7% were mixed acts, and 1% were unidentified [i.e. acts where the gender could not be assured], s. Figure 1. For the newly collected data comprising festivals from 2015 to mid-year of 2017, there were 15% female acts and 78% ‚ 7% , and 1% male, mixed and unidentified acts, respectively.
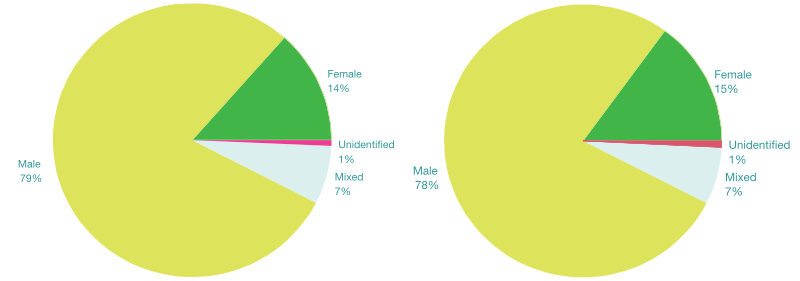
Figure 1. Gender proportions of festival acts [2012 to mid-year 2017]
Gender Proportions Over Time
Over time [2012 to mid-year 2017], there was a slight increase in the number of female artists [Figure 2] and a slight decrease in the number of male artists [Figure 3 and Table 2].
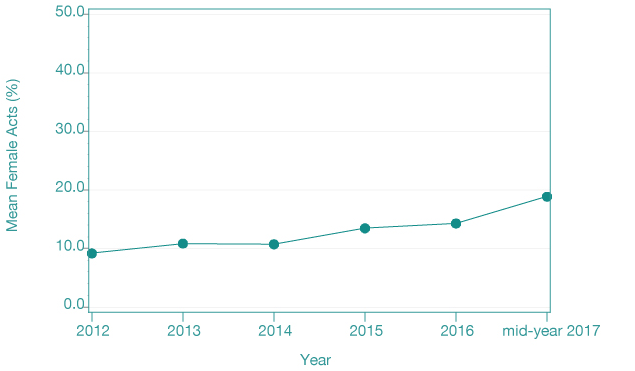
Figure 2. Female artists [in %] over time

Figure 3. Female, male and mixed artists [in %] over time
Table 2. Female, male, mixed and unidentified acts in % over time

For festivals with data for 4 or more years, we assessed changes over time per festival. Figure 4 shows the percentage of female acts separately for each festival. There seems to be an overall trend towards an increase in female acts for several festivals. Results for further festivals are shown in Appendix 3.
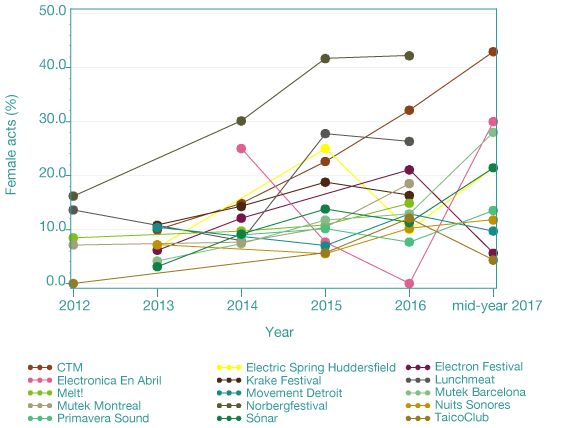
Figure 4. Female festival acts [in %] for festivals with data for 4 or more years
Gender Proportions for Different Regions
Comparing European and North American festival data, the same rates of female acts were seen [14%, s. Figure 4]. Results for further regions are shown in Appendix 1.

Figure 5. Gender rates for European and North American festivals [2012 to mid-year 2017]
Gender Proportions by Country
Gender proportions seem quite different when looking at various counties. For example, festivals in Belgium and Japan have the lowest female percentages [less than 7%] while festivals in Canada and Austria are highest [over 17%, Table 5]. Results for further countries are shown in Appendix 3.
Table 3. Female, male, mixed and unidentified acts by country [for countries with 10 or more festival editions, 2012 to mid-year 2017]

Gender Proportions by Size
We also wanted to see, if gender proportions depend on the size of the festival. Lacking visitor numbers, we used the number of total acts to categorize festivals into three groups as well as more refined into five groups. Figure 6 / Table 4 show that the number of female acts is similar across the three categories, while Figure 7 / Table 5 for five categories.

Figure 6. Female, male, mixed and unidentified acts by festival size in three categories [2012 to mid-year 2017]
Table 4. Female, male, mixed and unidentified acts by festival size in three categories [2012 to mid-year 2017]

Table 5. Female, male, mixed and unidentified acts by festival size in five categories [2012 to mid-year 2017]
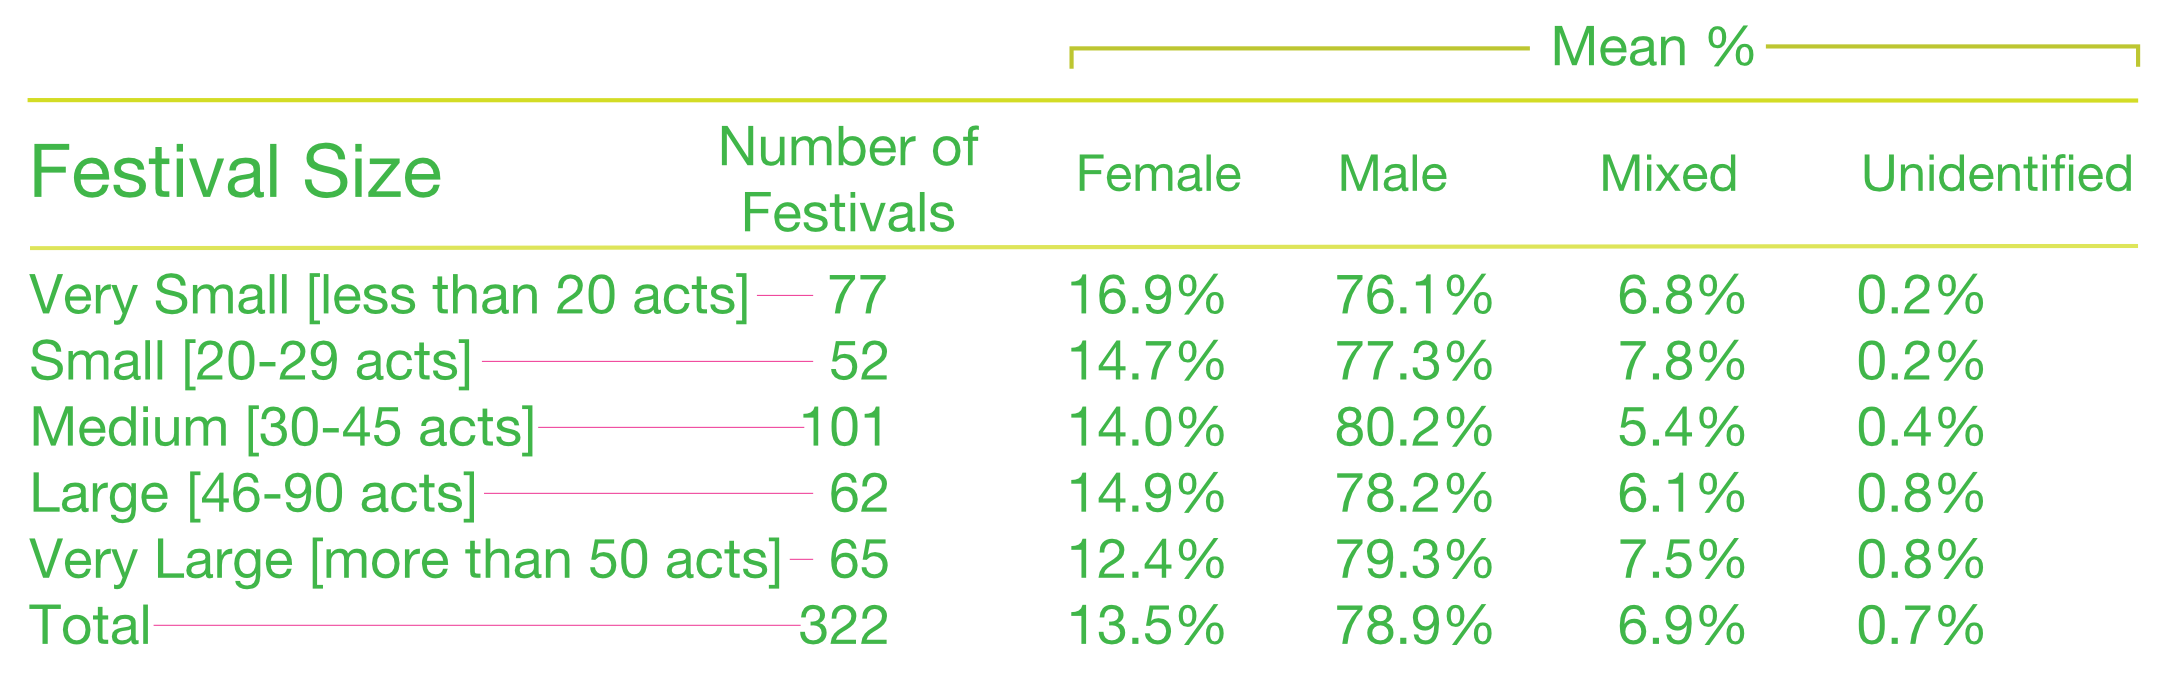
Figure 7 shows the percentage of female acts for each festival by the size of the respective festival [festival size is defined by the total number of acts] with extremes of 0% women as well as 100% women.

Figure 7. Female acts [in %] by festival size [defined by the total number of acts, 2012 to mid-year 2017]
